Vol.32 (Apr) 2022 | Article no.5 2022
The compact neutron emission spectrometer (CNES) having a tangential sightline was installed to observe a significant Doppler shift of the neutron energy due to the high-energy tangential neutral beam (NB) injections in the Large Helical Device (LHD) for understanding of the energy distribution of fast-ion. The CNES is based on a 1-inch diameter and 1-inch height EJ301 liquid scintillator coupled with a conventional 1-inch photomultiplier tube. The histogram of the integrated pulse signal (Qtotal) during different NBs heating phases measured by the CNES shows that the edge of Qtotal changes depending on NB directions. Using the simple derivative unfolding technique, the neutron energy spectra were unfolded from the measured Qtotal histogram. Peaks of the neutron energy shift to 2.0 MeV, 2.42 MeV, and 3.0 MeV according to the injection direction of NBs. The obtained neutron energy is almost consistent with the virgin deuterium-deuterium neutron energy evaluated by the simple two-body kinematics considering the sightline of CNES, NB injection angle, and NB injection energy.
Understanding fast-ion confinement is one of the issues for obtaining high-performance plasmas because plasmas are auxiliary heated by fast-ions created by neutral beam (NB) injection and/or ion cyclotron heating. Predominantly, fast-ion transport due to fast-ion driven magnetohydrodynamic (MHD) instability is one of the key topics for fast-ion confinement study [1]. In the Large Helical Device (LHD), a study of fast-ion transport due to fast-ion-driven MHD instability has been performed using intensive NBs [2]. In hydrogen experiments, beam ion transport/loss due to toroidal Alfvén eigenmode has been studied using a neutral particle analyzer [3] and a fast-ion loss detector [4]. Although the transport and loss process due to toroidal Alfvén eigenmode was revealed by comparing experimental results and numerical simulations [5, 6], information of fast-ion confinement was limited in real and phase spaces. By starting the deuterium experiment in LHD in March 2017, global information of confined fast-ions can be obtained using a comprehensive neutron diagnostic [7,8,9,10] because neutrons are mainly created by the fusion reaction between fast-ion and bulk plasma [11]. Time evolution of neutron emission profile obtained in energetic-ion-driven resistive interchange mode discharge in the experiment and numerical simulation revealed the substantial radial transport of beam ions [12, 13]. For a deeper understanding of the excitation of fast-ion-driven MHD instability and resonance between fast-ion and fast-ion-driven MHD instability, the energy distribution of fast-ion is necessary. In particular, high-acceleration energy NBs are installed in LHD. Therefore, beam ion distribution can be observed as the significant Doppler shift of the neutron energy due to the high-energy NBs. A tangential line-of-sight compact neutron emission spectrometer based on an EJ301 liquid scintillation detector (the so-called CNES) is newly implemented in LHD to obtain the energy distribution of beam ions created by tangential NBs. In this work, neutron spectroscopy during different NB heating is reported.
This paper is organized in the following manner. The description of the experimental setup of the CNES in LHD is shown in Section 2. The neutron energy spectra measurement results during NBs heated deuterium plasma in LHD are presented in Section 3. Finally, in Section 4, the summary is given.
LHD is equipped with three tangential negative-ion-source-based NBs (NB#1, NB#2, and NB#3) and two perpendicular positive-ion-source-based NBs (NB#4 and NB#5), as shown in Fig. 1. Note that the tangency radius of NB#1, NB#2, and NB#3 injections are 3.75 m, 3.75 m, and 3.70 m, respectively. The CNES is newly installed at the tangential LHD port (the so-called 6T port) with tangential sightlines with a tangency radius of approximately 3.5 m. NB#2 injects beam ions that move away from the CNES, whereas NB#3 injects beam ions that move toward the CNES, and NB#5 injects beam ions in a perpendicular direction. By installing the CNES, the measurement of neutron energy spectra, reflecting the fast-ion distribution function, becomes newly possible. The advantage of the CNES is its compactness compared with the time-of-flight-type neutron emission spectrometer under commissioning on LHD [14] occupying the space of a cube 2 m on a side.
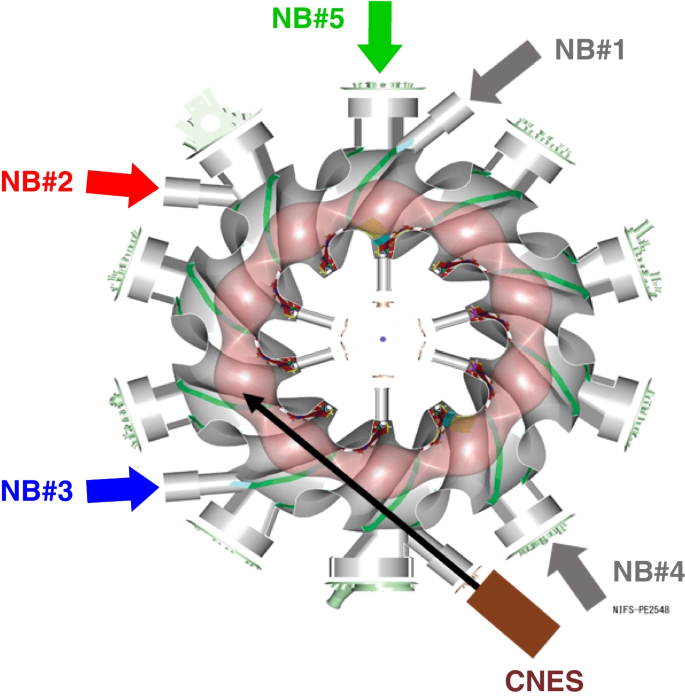
A schematic top view of the LHD, NBs, and CNES installed at LHD 6T port. The black arrow indicates the direction of the CNES line-of-sight
The CNES is installed at a distance of approximately 100 cm from the 6T port. The detector is enclosed in the shielding box. Figure 2a right shows the cut view schematic of the shielding box. To prevent the stray magnetic field effect on the photomultiplier tube (PMT), the detector is placed in the magnetic shielding made of SS400 with 1 cm thick. The outer layers are equipped with the γ-ray shielding made of 5 cm thick lead and neutron shielding made of 10% doped borated polyethylene with 30 cm width, 60 cm length, and 40 cm height. The collimator with an inner diameter of 3 cm is placed in front of the detector in order to enhance the directivity (Fig. 2b).
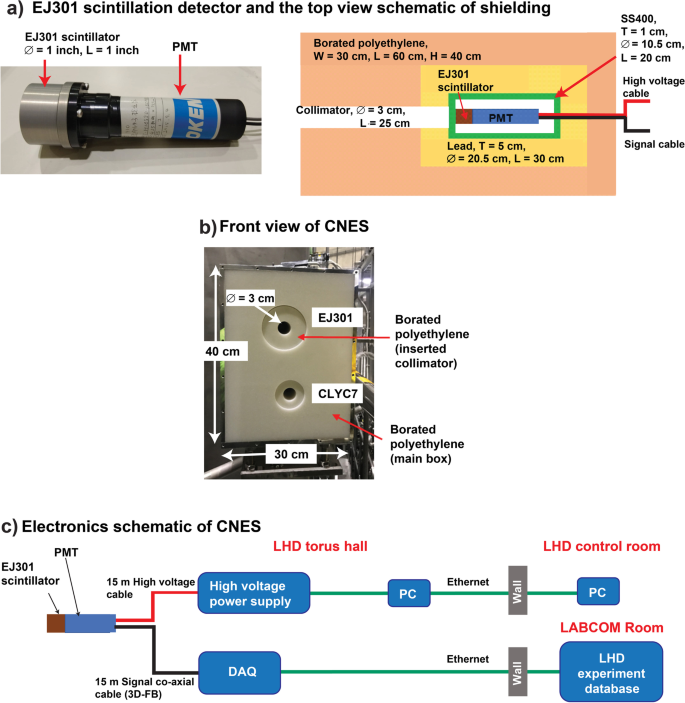
a Left: the EJ301 scintillation detector. Right: a cut view of the shielding box of CNES. b The front view of the shielding box. EJ301 detector is placed inside the upper hole with the height of 16 cm above the plasma midplane. Note that the CLYC7 detector is beyond the scope of this paper. c Electronics schematic of CNES
The EJ301 liquid scintillator [15], 1-inch in diameter and 1-inch in height, is directly coupled to a conventional 1-inch PMT (H10580-100-01, Hamamatsu Photonics K.K [16].) and is used as a fast-neutron detector (Fig. 2a left). The detector is biased with a high voltage of − 1000 V with an externally controllable quad high voltage power supply (RPH-033, HAYASHI-REPIC Corp [17].). The anode signal of the detector is directly fed into the fast digital data acquisition system (APV8102-14MWPSAGb, Techno AP Corp [18].). Then, the data is transferred to the LHD experiment database via 1 Gbps ethernet. Figure 2c shows the block diagram of the CNES. Figure 3a shows the typical waveform of the neutron and γ-ray induced pulse signals obtained by the CNES in LHD deuterium plasma discharge #162340. Pulse shape discrimination PSD \(=\frac{Q_{\mathrm{total}}-{Q}_{\mathrm{fast}}}{Q_{\mathrm{total}}}\), where Qtotal is an integrated signal in ttotal of 34 ns and Qfast is an integrated signal in tfast of 10 ns, is used for discriminating neutron and γ-ray. The acceptable pulse counting rate is decided to be 3.6 × 10⁵ cps, where the pulse pileup ratio is less than 1.5% in order to obtain reliable pulse height spectra. Figure 3b shows an example of a two-dimensional PSD plot obtained in #162340. Neutrons and γ-rays induced signals are discriminated by setting appropriate tfast. In the following analysis, PSD from 0.27 to 0.44 is recognized as a neutron signal. Note that the ratio of neutron signal and γ-ray signal is 5:1.
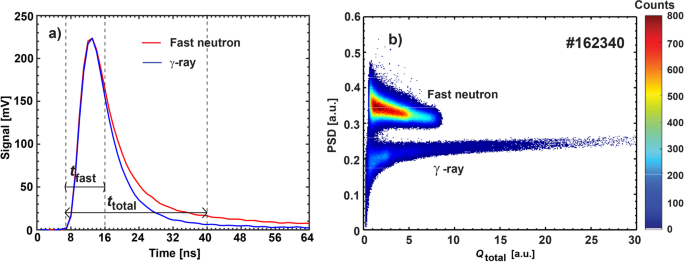
a The typical neutron and γ-ray induced signal measured by EJ301 scintillation detector. b Typical two-dimensional PSD plot obtained from LHD deuterium plasma discharge #162340
Measurement of the Doppler shift of neutron energy using CNES during NB injection was performed at deuterium plasma discharges from #162325 to #162358. The typical time evolution of plasma discharge is shown in Fig. 4. In the experiments, the magnetic axis position in vacuum Rax_vac is set to be 3.6 m and toroidal magnetic field strength BT is set to be 1 T with counterclockwise (CCW) directions viewed from the top. Here, NB#2, NB#3, and NB#5 are injected separately. During the NB#3 heating phase, NB#1 injects a hydrogen beam. Although the neutron emission from beam ions injected by NB#1 is negligibly small compared with NB#3 components, NB#1 might affect the fast-ion distribution function through the nonlinear collision [19]. The experiments were performed in a relatively low-electron temperature condition in order to maintain the low total neutron emission rate (Sn) so to avoid the counting loss of the CNES. The neutron counting rate obtained by CNES in each NB phase is compared to Sn obtained by a neutron flux monitor (NFM) [7, 20], as shown in Fig. 5a). The ratios of the neutron counting rate of the CNES to Sn are ~4.56 × 10⁻⁹, ~4.03 × 10⁻⁹, and ~2.26 × 10⁻⁹ for NB#3, NB#2, and NB#5 phases, respectively (see Fig. 5b). Here, the viewing angle is calculated based on the sightline of CNES and the NB injection angle. The relation of the neutron counting rate obtained by CNES and Sn is different in each phase because of the anisotropy of the deuterium-deuterium fusion neutron emission. In a previous study, the anisotropy effect of the deuterium-deuterium neutron was observed using the neutron activation system installed on the outboard side of LHD [21]. In contrast, the effect is negligibly small for the neutron flux monitor installed on the top [22]. The anisotropy of deuterium-deuterium neutron emission obtained using CNES is consistent with the neutron activation system measurement. The operational range in CNES pulse counting rate is up to 3.6 × 10⁵ cps which corresponds to the neutron counting rate of 3.0 × 10⁵ cps because the ratio of neutron signal and γ-ray is 5:1. As shown in Fig. 5, the linearity of the neutron counting rate is limited at the neutron pulse counting rate of 3 × 10⁵ cps corresponding to Sn ~6 × 10¹³ n/s for the NB#3 injection case. The histogram of Qtotal is measured by the CNES during different NB phases and is shown in Fig. 6. Time intervals from 4.20 s to 4.30 s, 5.60 s to 6.10 s, and 7.20 s to 7.30 s are selected for NB#3, NB#5, and NB#2 phases, respectively. The edge position in Qtotal is relatively high in the NB#3 case, whereas the Qtotal edge position is relatively low in the NB#2 case. The edge position of Qtotal in the NB#5 case is located between the NB#3 and the NB#2 cases.
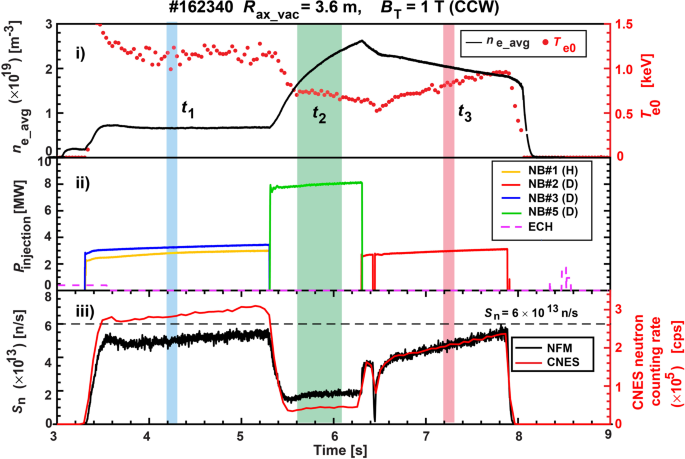
Time evolution of deuterium plasma discharge #162340. Panel: i Line-averaged electron density (ne_avg) and central electron temperature (Te0); ii injected power of NBIs heating; and iii Sn (left-axis) and neutron counting rate measured by CNES (right-axis). Three-time slices, t1: 4.20 s to 4.30 s (blue-shaded), t2: 5.60 s to 6.10 s (green-shaded), and t3: 7.20 s to 7.30 s (red-shaded), are selected to determine the pulse height spectra measured by CNES
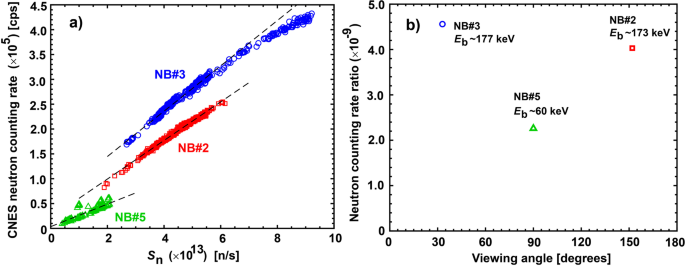
a Comparison of neutron counting rate measured by CNES and Sn measured by NFM obtained from LHD deuterium plasma shots #162325-#162358. The trends are different in the NB phases. b The ratios of the neutron counting rate of CNES to Sn during NB#3, NB#5, and NB#2 phases. The viewing angle is estimated from the sightline of CNES and the NB injection angle
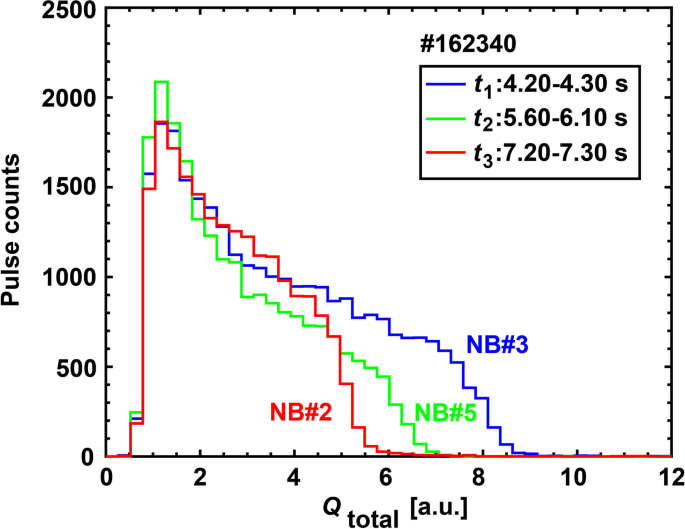
Histogram of Qtotal obtained during different NB heating phases. The edge position of Qtotal changes according to NBs direction
To unfold the neutron energy spectra from the Qtotal histogram, the simple derivative unfolding technique [23, 24] is used because the Qtotal corresponds to the recoiled proton energy deposited in the scintillator. Qtotal is changed to electron equivalent energy Ee [MeVee] using the Compton edge measured from 137Cs and 60Co γ-ray calibration sources. The relation of Qtotal = 13.96×Ee [MeVee] is obtained. Further, using the through the light output L as a function of recoil particle energy [25] shown in Fig. 7a, recoil proton energy (Ep) as a function of Ee is obtained. The unfolded neutron energy spectra was obtained with the calculation of differential neutron flux (∅(E)) that can be expressed as [22]: \(\phi (E)=\frac{-{E}_p}{TnV\sigma \left({E}_p\right)}\left[{y}^{\prime }(x){\left\{g{L}^{\prime}\left({E}_p\right)\right\}}^2+y(x)g{L}^{\prime \prime}\left({E}_p\right)\right]\) where T is the time duration [s], n is the density of hydrogen atom [cm-3], V is the sensitivity volume [cm3], σ is the neutron-proton elastic scattering cross section [cm-2], y(x) is Qtotal histogram, and the PMT gain g is set to be 6.6×10⁵. Note that the detection efficiency is not taken into account in this calculation. Here, ′ and ′′ represent the first and the second derivatives, respectively. Unfolded neutron energy spectra shown in Fig. 7b indicates that the peaks of neutron energies located above 2 MeV, which corresponds to the virgin deuterium-deuterium neutron in NB#2, NB#5, and NB#3 phases are 2.0 MeV, 2.42 MeV, and 3.0 MeV, respectively. The peaks in neutron energy below 1.5 MeV may be due to the scattered neutron. The virgin deuterium-deuterium neutron energy to be observed by CNES is compared with the simple calculation based on the two-body kinematics. Here, the fusion reaction of a cold deuteron and a beam deuteron having the NB injection energy occurred at the magnetic axis position with the finite beta (3.86 m) is considered. The viewing angle is estimated from the CNES sightline and the NB injection angle shown in Fig. 5b. The virgin deuterium-deuterium neutron energies are calculated to be 2.11 MeV, 2.45 MeV, and 2.93 MeV during NB#2, NB#5, and NB#3 heating phases, respectively. The experimentally obtained neutron energies are almost consistent with the neutron energies expected from the simple two-body kinematics. The detailed analysis of the fast-ion energy distribution, including the effect of the hydrogen NB#1 injection, using calculation based on the drift kinetic code such as GNET [26] will be our future work.
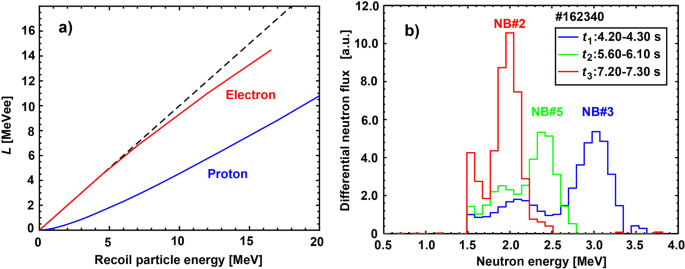
a Light output L as a function of the recoil particle energy [25]. b The unfolded neutron energy spectrum
The neutron spectroscopy is performed in NB heated LHD plasma by the newly installed CNES having the tangential sightlines. The CNES consists of an EJ301 liquid scintillator, PMT, the externally controllable high voltage power supply, and the novel fast data acquisition system. The neutron energy spectra were measured in deuterium discharges with various NB injection conditions. The anisotropy of the deuterium-deuterium fusion neutron emission measured by the CNES is consistent with the result obtained by the neutron activation system. The histograms of Qtotal during different NB heating phases are measured. Qtotal becomes lower and higher during the NB#2 and the NB#3 injections, respectively. In this work, the derivative unfolding technique is used in order to unfold the neutron energy spectra from the Qtotal histograms. The neutron energies measured by CNES are consistent with the neutron energies expected from the simple two-body kinematics calculation. The results show that the neutron energies become higher during NB#3 and lower during NB#2 due to the Doppler effect when the beam ions move toward and move away from the CNES.
The data that support the findings of this study are available from the corresponding author upon reasonable request.
W. W. Heidbrink, “Basic physics of Alfvén instabilities driven by energetic particles in toroidally confined plasmas”, Phys. Plasma 15, 055501 (2008). https://doi.org/10.1063/1.2838239.
K. Toi et al., “Energetic-ion-driven global instabilities in stellarator/helical plasmas and comparison with tokamak plasmas”, Plasma Phys. Control. Fusion 53, 024008 (2011). https://doi.org/10.1088/0741-3335/53/2/024008.
M. Osakabe et al., “Experimental observations of enhanced radial transport of energetic particles with Alfvén eigenmode on the LHD”,Nucl. Fusion 46, S911 (2006). https://doi.org/10.1088/0029-5515/46/10/S07.
K. Ogawa et al., “Observation of energetic-ion losses induced by various MHD instabilities in the Large Helical Device (LHD)”, Nucl. Fusion 50, 084005 (2010). https://doi.org/10.1088/0029-5515/50/8/084005.
K. Ogawa et al., “Magnetic configuration effects on TAE-induced losses and a comparison with the orbit-following model in the Large Helical Device”, Nucl. Fusion 52, 094013 (2012). https://doi.org/10.1088/0029-5515/52/9/094013.
R. Seki et al., “Comprehensive magnetohydrodynamic hybrid simulations of Alfvén eigenmode bursts and fast-ion losses in the Large Helical Device”, Nucl. Fusion 59, 096018 (2019). https://doi.org/10.1088/1741-4326/ab266e.
M. Isobe et al., “Neutron Diagnostics in the Large Helical Device”, IEEE Trans. Plasma Sci. 46, 2050 (2018). https://doi.org/10.1109/TPS.2018.2836987
M. Isobe et al., “Fusion neutron production with deuterium neutral beam injection and enhancement of energetic-particle physics study in the large helical device”, Nucl. Fusion 58, 082004 (2018). https://doi.org/10.1088/1741-4326/aabcf4.
K. Ogawa et al., “Energetic ion confinement studies using comprehensive neutron diagnostics in the Large Helical Device”, Nucl. Fusion 59, 076017 (2019). https://doi.org/10.1088/1741-4326/ab14bc
K. Ogawa et al., “Progress on Integrated Neutron Diagnostics for Deuterium Plasma Experiments and Energetic Particle Confinement Studies in the Large Helical Device During the Campaigns from FY2017 to FY2019”, Plasma Fusion Res. 16, 1102023 (2021). https://doi.org/10.1585/pfr.16.1102023.
M. Osakabe et al., “Current Status of Large Helical Device and Its Prospect for Deuterium Experiment”, Fusion Sci. Technol. 72, 199 (2017). https://doi.org/10.1080/15361055.2017.1335145
K. Ogawa et al., “Effect of the helically-trapped energetic-ion-driven resistive interchange modes on energetic ion confinement in the Large Helical Device”, Plasma Phys. Control. Fusion 60, 044005 (2018). https://doi.org/10.1088/1361-6587/aaab1f
K. Ogawa et al., “Energetic particle transport and loss induced by helically-trapped energetic-ion-driven resistive interchange modes in the Large Helical Device”, Nucl. Fusion 60, 112011 (2020). https://doi.org/10.1088/1741-4326/ab6da0
Y. Zhang et al., “Design and optimization of an advanced time-of-flight neutron spectrometer for deuterium plasmas of the large helical device”, Rev. Sci. Instrum. 92, 053547 (2021). https://doi.org/10.1063/5.0043766
See https://eljentechnology.com/products/liquid-scintillators/ej-301-ej-309 for the specification of the EJ301 scintillator.
See https://www.hamamatsu.com/resources/pdf/etd/High_energy_PMT_TPMZ0003E.pdf for H10580-100-01 for the photomultiplier tube.
See https://www.h-repic.co.jp/pdf/RPH-034.pdf for the Quad high voltage power supply.
K. Ogawa et al., “The large helical device vertical neutron camera operating in the MHz counting rate range”, Rev. Sci. Instrum. 89, 113509 (2018). https://doi.org/10.1063/1.5054818
H. Nuga et al., “Analysis of beam slowing-down process in large helical device based on Fokker–Planck operator including beam–beam Coulomb collision effect”, Nucl. Fusion 59, 016007 (2019). https://doi.org/10.1088/1741-4326/aaeaf4
M. Isobe et al., “Wide dynamic range neutron flux monitor having fast time response for the Large Helical Device”, Rev. Sci. Instrum. 85, 11E114 (2014). https://doi.org/10.1063/1.4891049
S. Sugiyama et al., “Observation of neutron emission anisotropy by neutron activation measurement in beam-injected LHD deuterium plasmas”, Nucl. Fusion 60, 076017 (2020). https://doi.org/10.1088/1741-4326/ab90c9
T. Nishitani et al., “Estimation of the Fast-Ion Anisotropy Effect on the Neutron Source Intensity Measurement and the Experimental Observation”, IEEE Trans. Plasma Sci. 47, 12 (2019). https://doi.org/10.1109/TPS.2018.2846776
D. R. Slaughter, Proc. Seminar Workshop on Radiation energy spectra unfolding, ORNL-RSIC-40, Oak Ridge National Laboratory, Oak Ridge, TN (1976).
D. R. Slaughter and R. Strout II, “Flyspec: A simple method of unfolding neutron energy spectra measured with NE213 and stilbene spectrometers”, Nucl. Instrum. Methods 198, 349–355 (1982). https://resolver.scholarsportal.info/resolve/01675087/v198i2-3_l/349_fasmoumwnass.xml.
V. V. Verbinski et al., “Calibration of an organic scintillator for neutron spectrometry“, Nucl. Instrum. Methods 65, 8–25 (1968). https://doi.org/10.1016/0029-554X(68)90003-7.
H. Yamaguchi and S. Murakami, “Simulation study of NBI heating in the time-evolving and multi-ion-species plasmas of LHD”, Nucl. Fusion 56, 026003 (2016). https://doi.org/10.1088/0029-5515/56/2/026003.
This research was supported by NIFS Collaboration Research programs (KOAH037), by the Japan-China Post-Core-University-Program, Post-CUP, by the NINS program of Promoting Research by Networking among Institutions (Grant Number 01411702), and by Excellence Program of Hefei Science Center CAS (No.2020HSC-UE012). We are pleased to acknowledge the assistance of the LHD Experiment Group.
Not applicable
S. Sangaroon, K. Ogawa, and M. Isobe equally contributed to all aspects of the manuscript. All authors read and approved the final manuscript.
Not applicable
Not applicable
The authors declare that they have no competing interests.
Springer Nature remains neutral with regard to jurisdictional claims in published maps and institutional affiliations.
If you'd like to subscribe to the AAPPS Bulletin newsletter,
enter your email below.